Data Visualization
Description
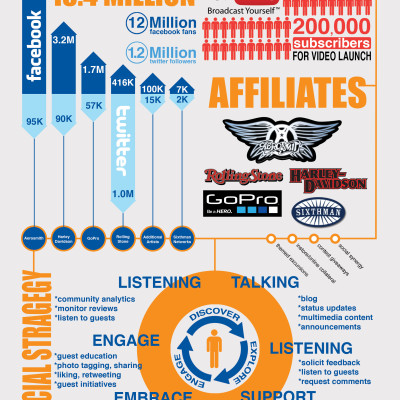
Contained within this portfolio are several examples of data analysis, presented in a visual form. These infographics were created from sourced data in order to help better disseminate a mass of information in an easily digestible format, available to anyone. These examples were created in Adobe Illustrator and Photoshop.
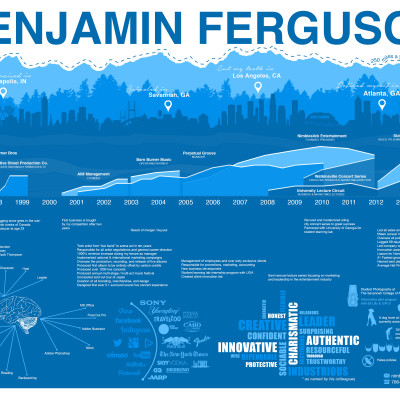
- Personal Resume: the challenge of visually representing my own professional trajectory while incorporating a few personal details helped to shape this project, with the end goal representing more data and character than a traditional resume.
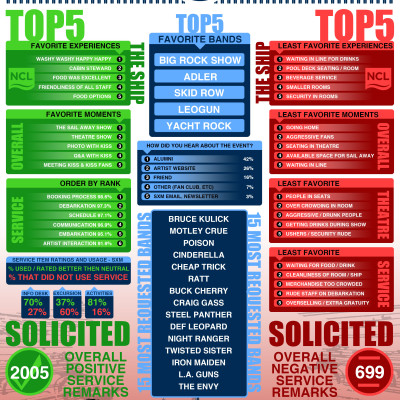
- Sharing the results of a twenty page event wrap-up survey for KISS KRUISE, with over 1000 participants helped identify problems and gather information for the following year's event.
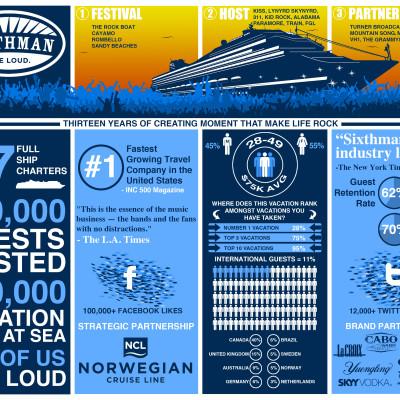
- The Sixthman company infographic was designed to communicate the company's highlights, goals, and achievements. Built as a template, it was updated twice a year to reflect an accurate count of company analytics.
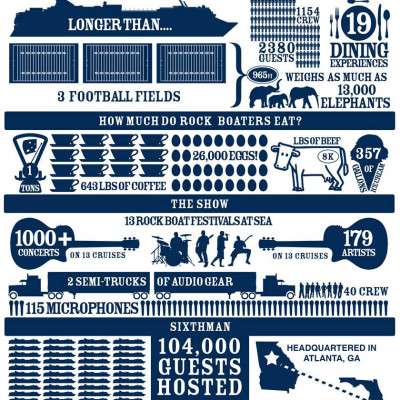
- Keeping passengers excited for their upcoming vacation, a year in advance, required a lot of engagement, story telling, and hype. As part of a behind the scenes series, this infographic was created to share interesting information about their cruise.
- Although it was never produced, this infographic was created to help convey the proposed foundation of building a new event around Aerosmith.
Clients
Personal
Sixthman, Ltd. / Norwegian Cruise Lines
KISS KRUISE
The Rock Boat
Info
